Dashboard
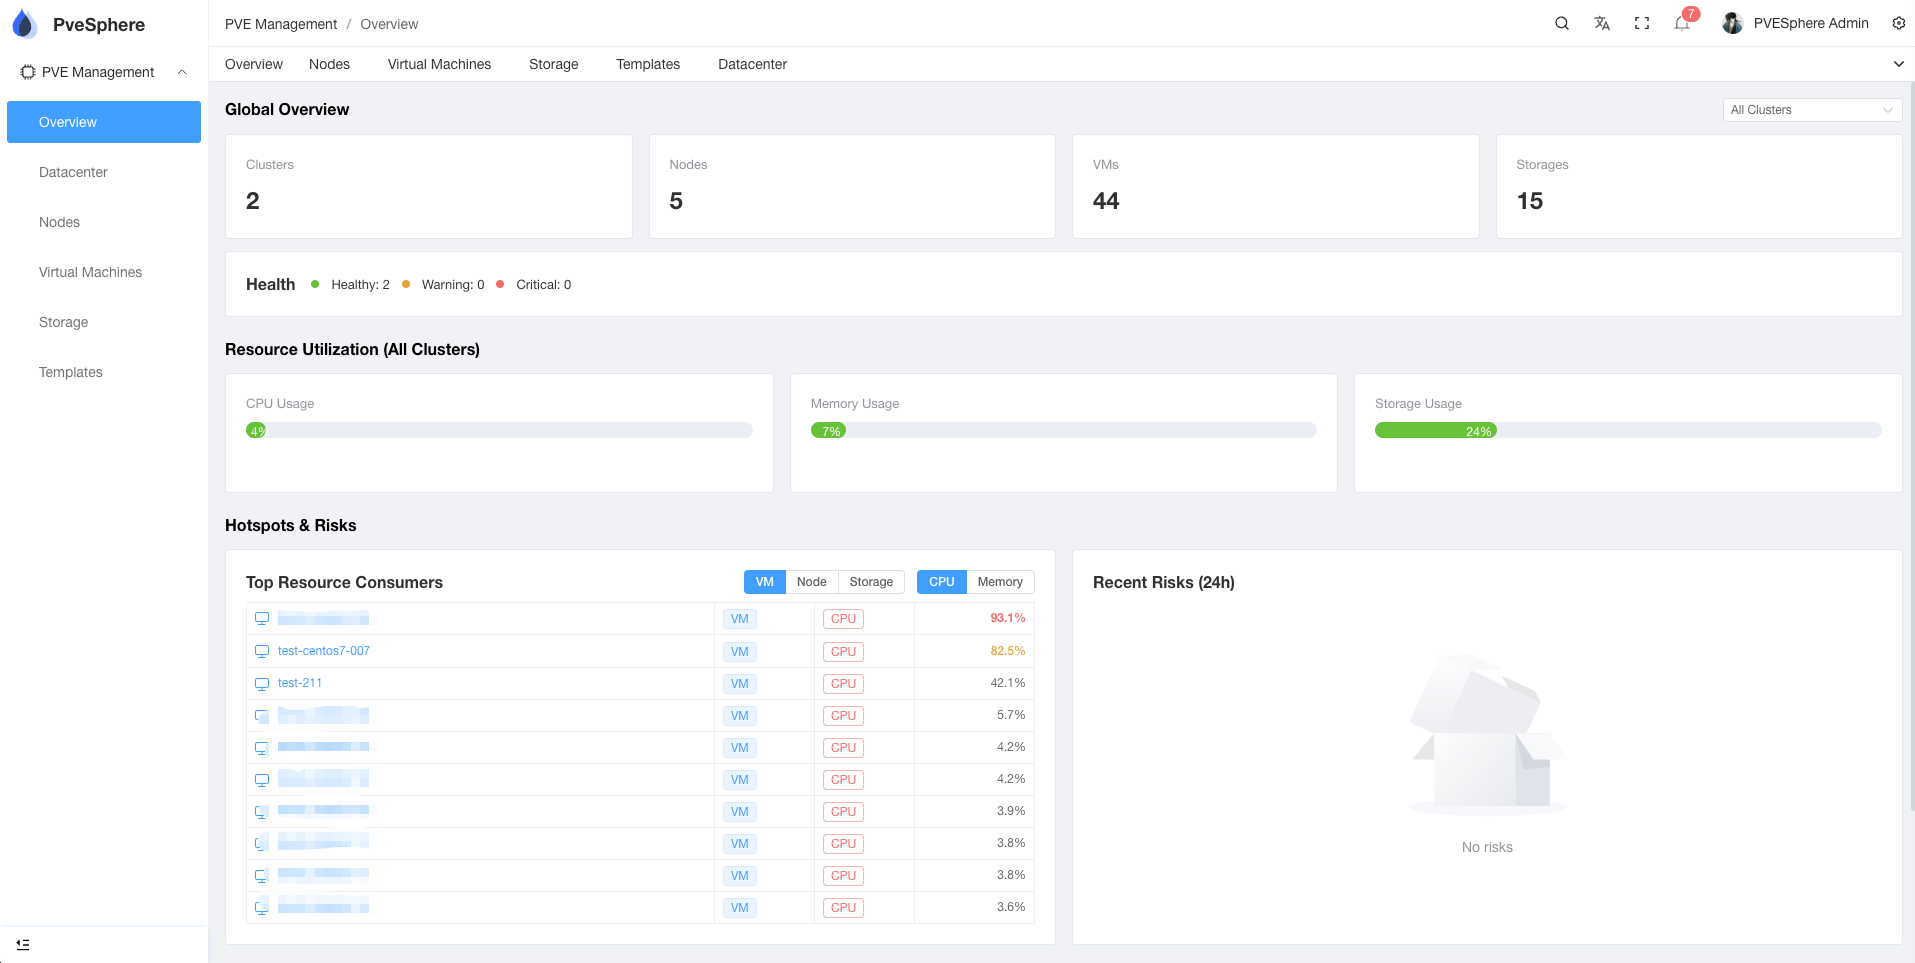
The dashboard provides a global overview of the PveSphere system, helping you quickly understand the status of all clusters, nodes, virtual machines, and storage.
Feature Overview
Resource Statistics
The top of the dashboard displays key resource statistics:
- Total Clusters: Number of PVE clusters added
- Total Nodes: Number of physical nodes across all clusters
- Total VMs: Number of virtual machines across all clusters
- Total Storage: Total capacity of all storage
Resource Utilization
Real-time display of resource utilization metrics:
- CPU Usage: CPU usage across all nodes
- Memory Usage: Memory usage across all nodes
- Storage Usage: Usage across all storage
Hotspots and Risks
Top Resource Consumers
Displays entities with the highest resource consumption:
- VM: Virtual machines sorted by CPU or memory usage
- Node: Nodes sorted by resource usage
- Storage: Storage sorted by usage
Recent Risks (24h)
Displays risk alerts in the last 24 hours:
- Resource alerts
- Health check failures
- Performance issues
Multi-Cluster Switching
You can switch between different environment cluster views using the environment filter:
- All: Display all clusters
- test: Display only test environment clusters
- dev: Display only development environment clusters
- prod: Display only production environment clusters
Usage Tips
- Real-time Refresh: Click the refresh button to update the latest data
- Filter View: Use the environment filter to view resources in specific environments
- Quick Navigation: Click resource cards to quickly jump to corresponding management pages